Skip to content
Avrox Asset
Menu
CRZ pricing
Macro expression
Historical example · 15 November 2023
Discuss your desk
CRZ pricing · historical worked case

Three ways to express
a rates view

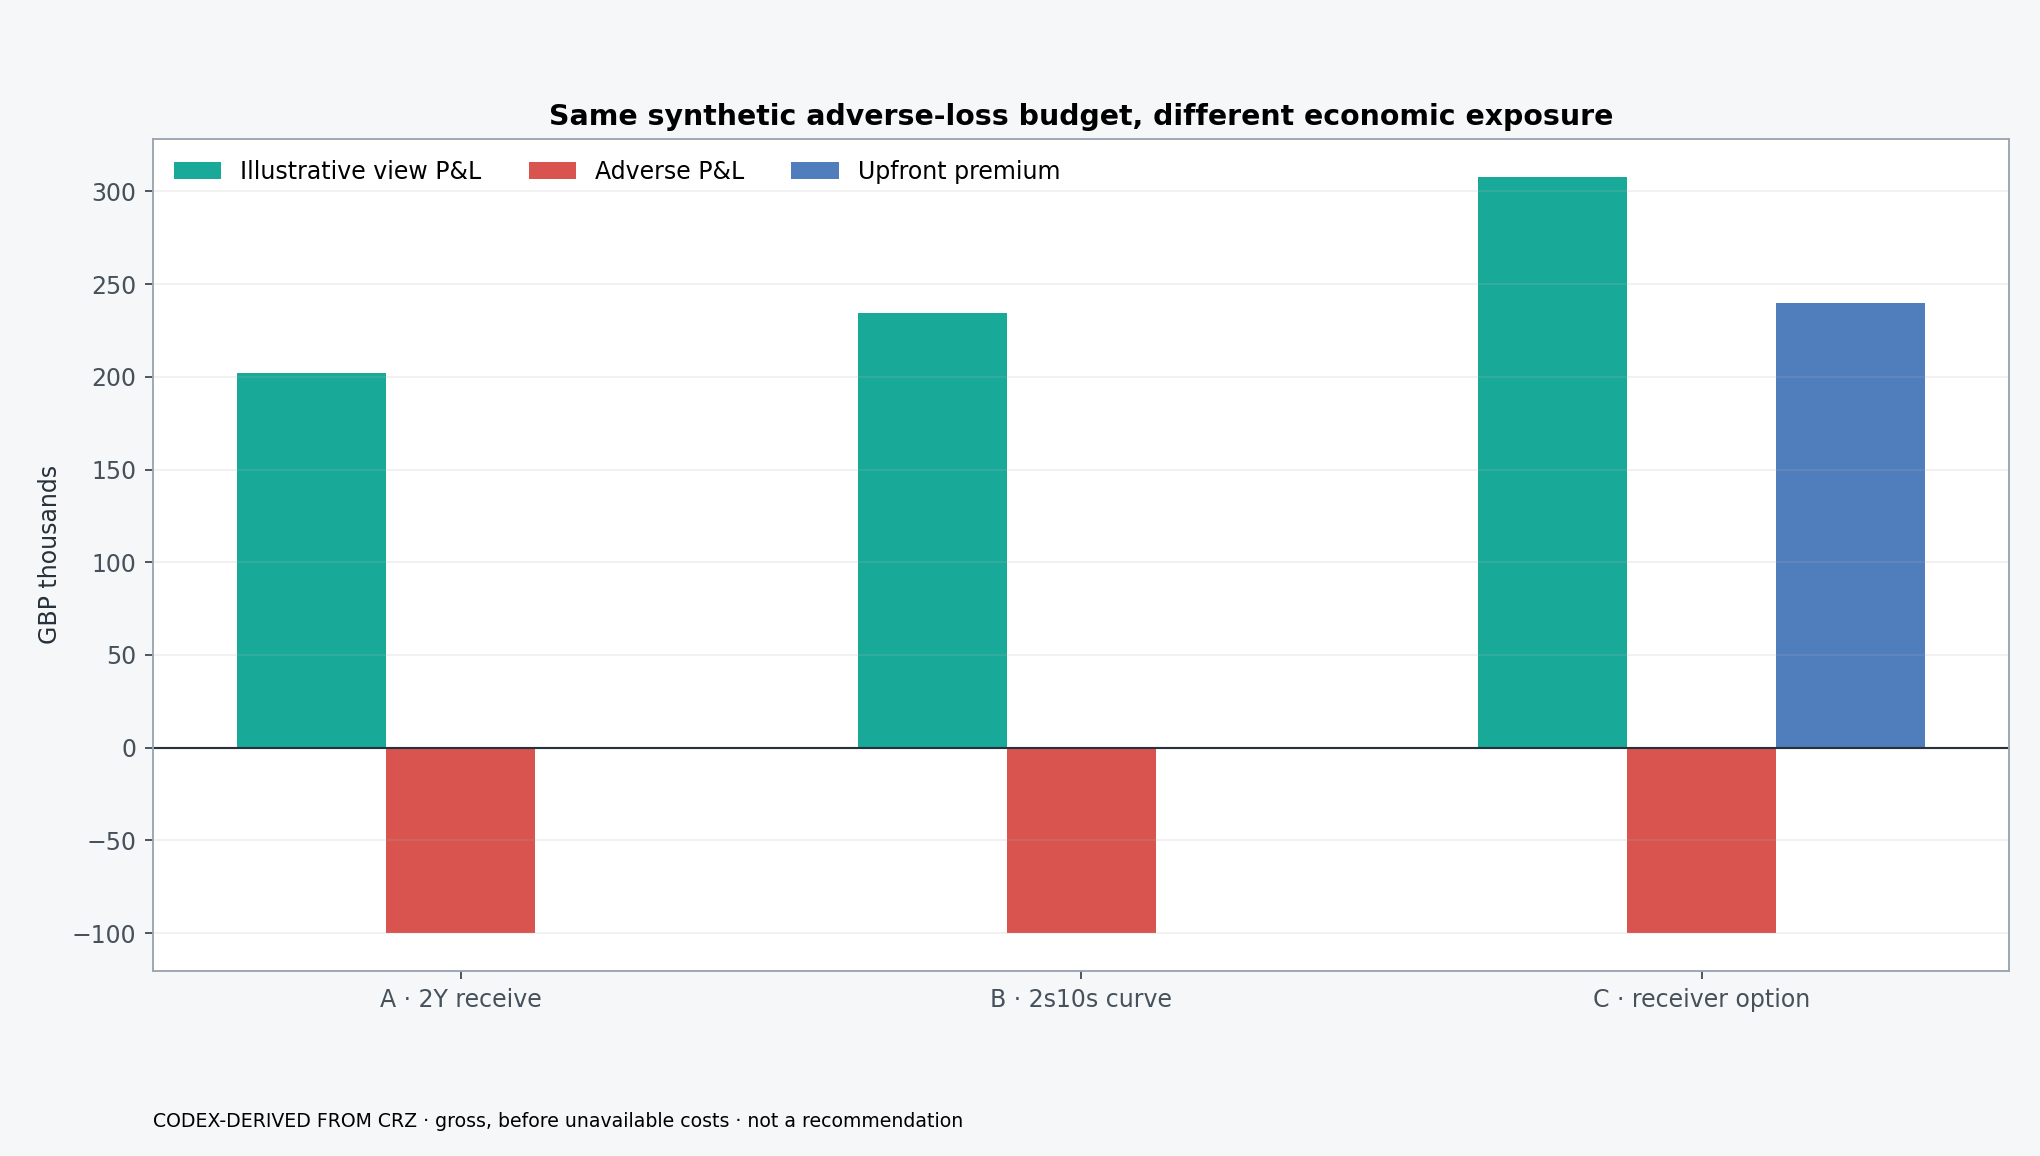
A trader expects short-term rates to fall faster than long-term rates. This example compares a two-year swap, a curve trade and a receiver swaption, using CRZ calculations on the market of 15 November 2023. Each position is sized to lose £100,000 in the same adverse scenario.

CRZ market
Close · 15 November 2023
Illustrative view
2Y −50bp · 10Y −15bp
Adverse case
2Y +25bp · 10Y +10bp
Same loss budget
£100,000

Three standard expressions

Each synthetic position is sized to lose £100,000 under the same adverse CRZ scenario, making the risk shapes directly comparable.

Compare the trades

Compare exposure, upfront premium and response across the named view, adverse case and full scenario grid.
Comparison of three synthetic GBP rates expressions
ExpressionNotional / legsUpfrontNamed-view gross P&LAdverse gross P&LGrid rangeParallel PV01
(GBP / +1bp)
Convexity
(GBP / 1bp²)
Vega
(GBP / +1 normal-vol bp)
Main risk
Most directA · outright 2Y durationOwns the front-end level directly.
Curve expressionB · parallel-DV01-neutral 2s10sParallel DV01 neutral; tenor-bucket exposure retained.
Convex expressionC · receiver optionAdds premium, expiry and volatility exposure.

Compare market scenarios

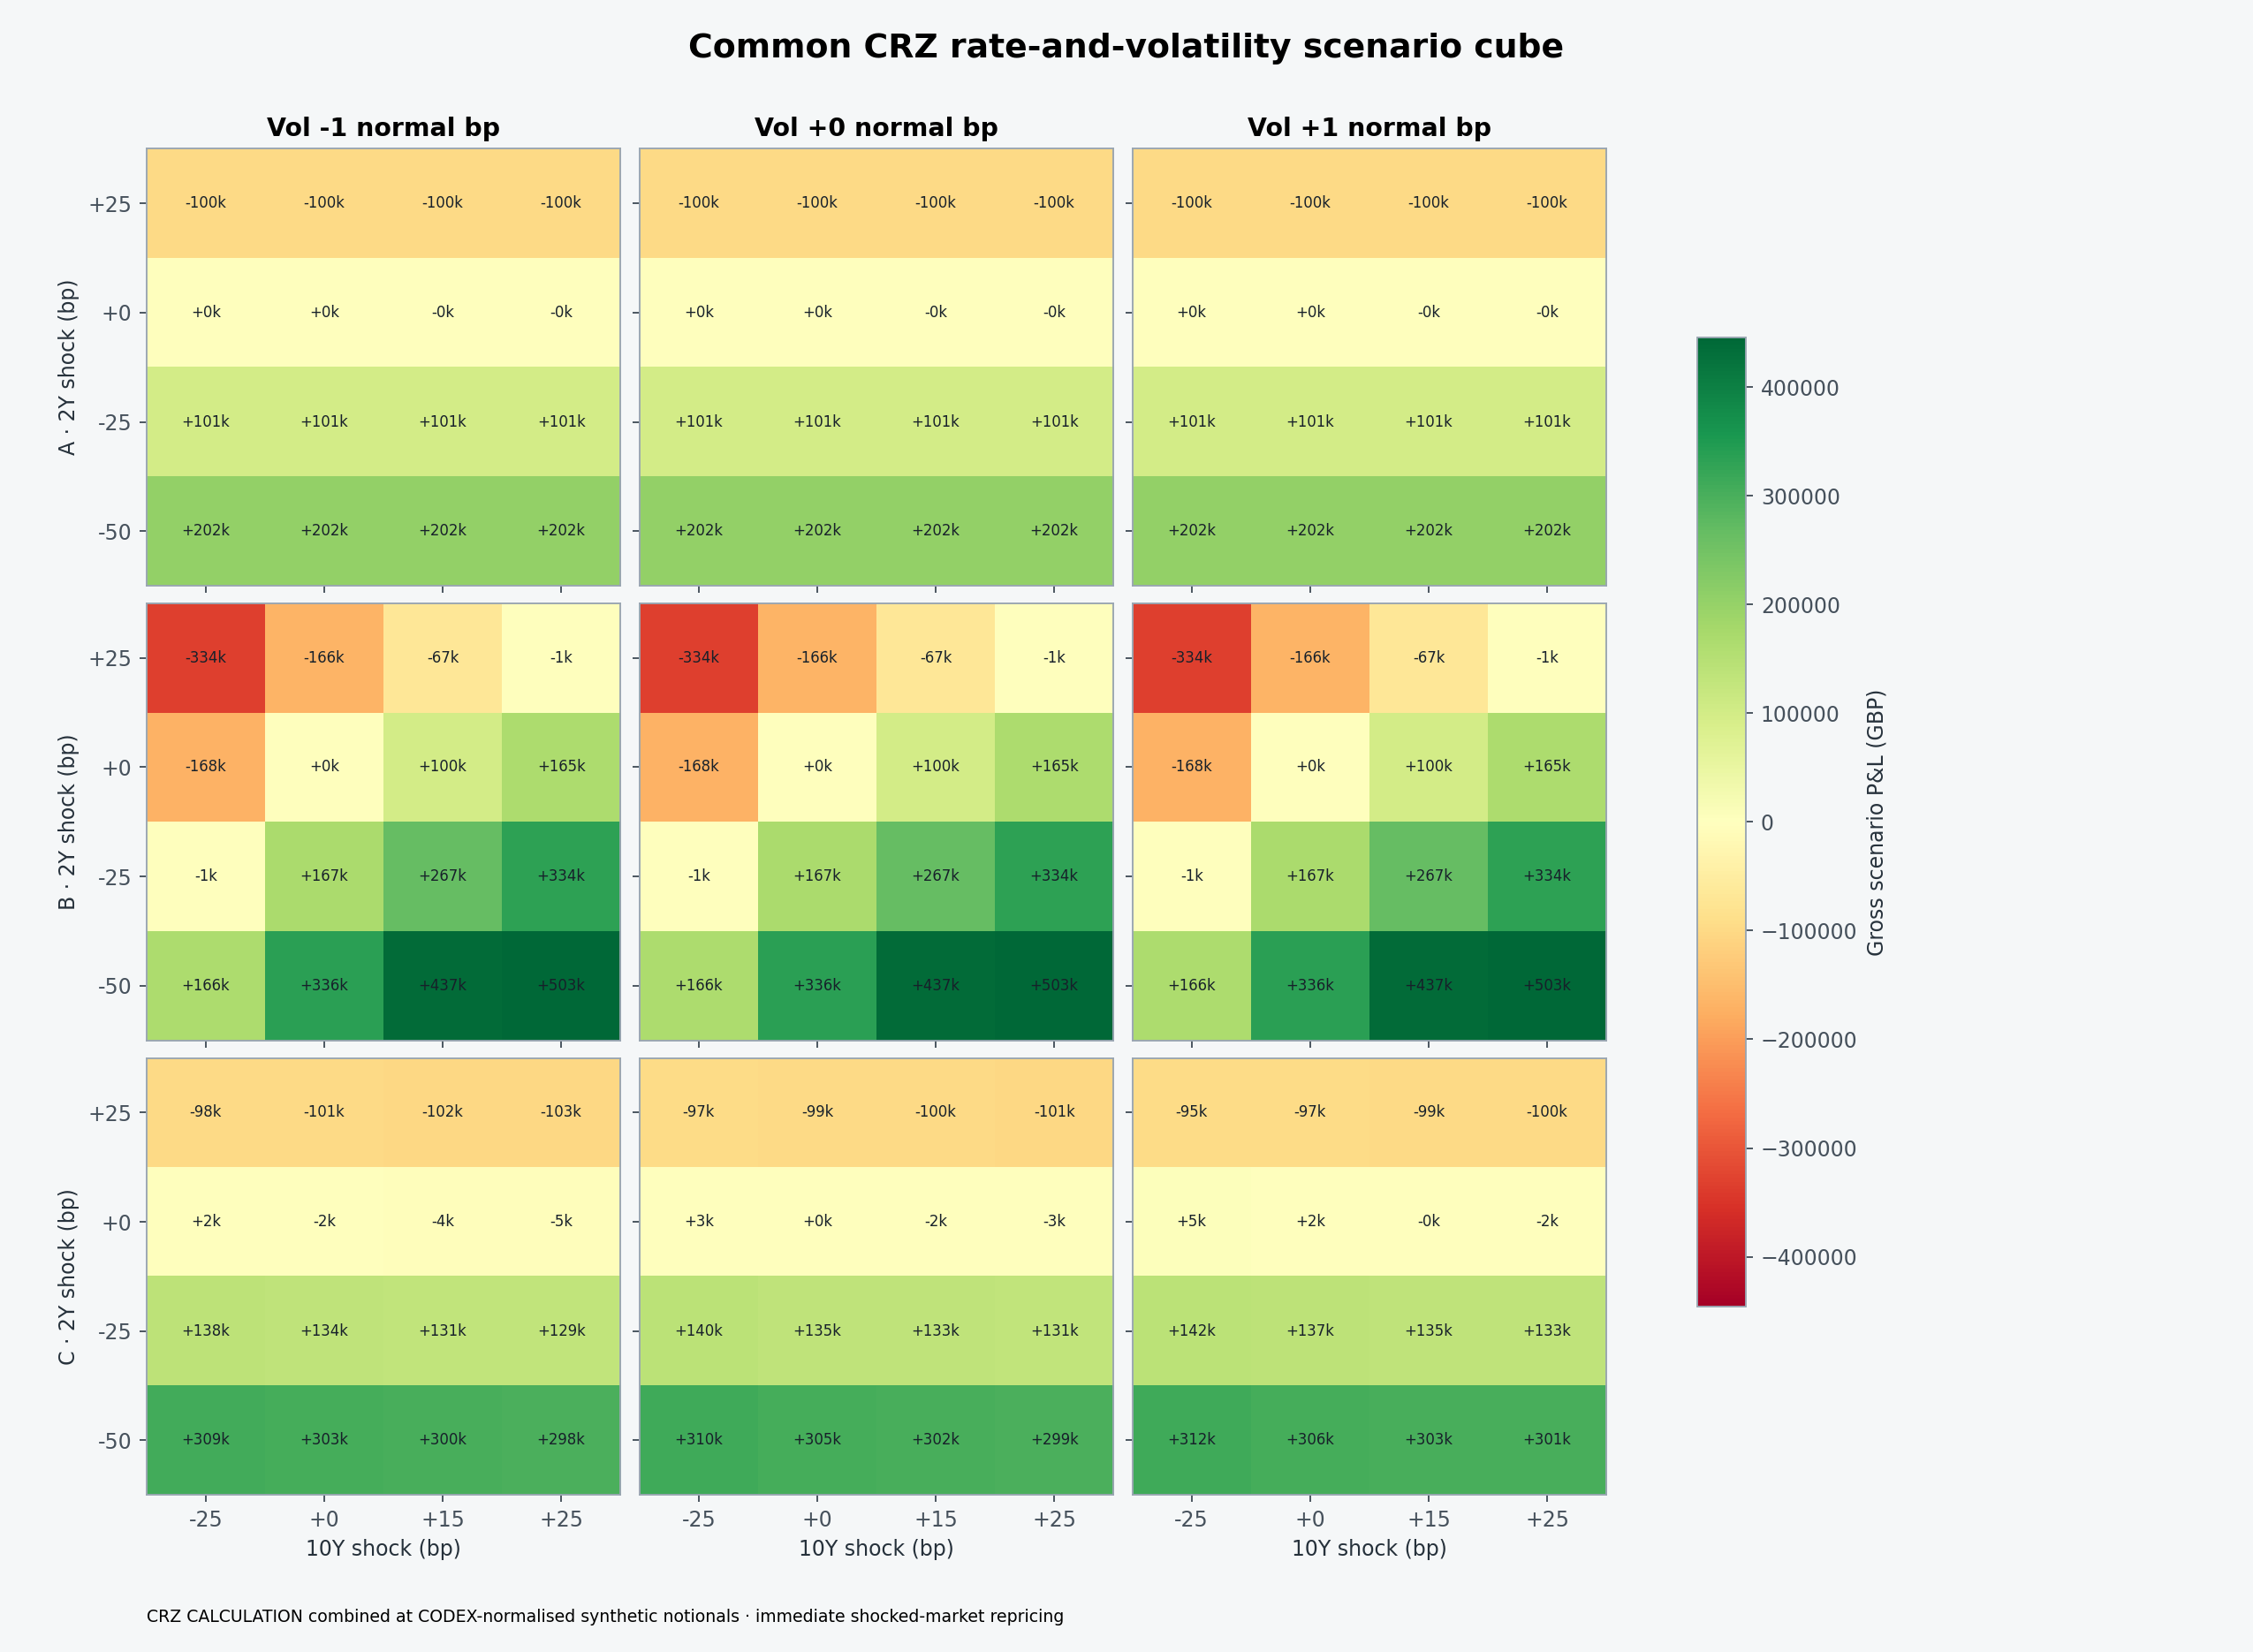
Select a scenario to see the recorded CRZ valuations. The figures measure the immediate change in value before trading costs.

Risk shape and convexity

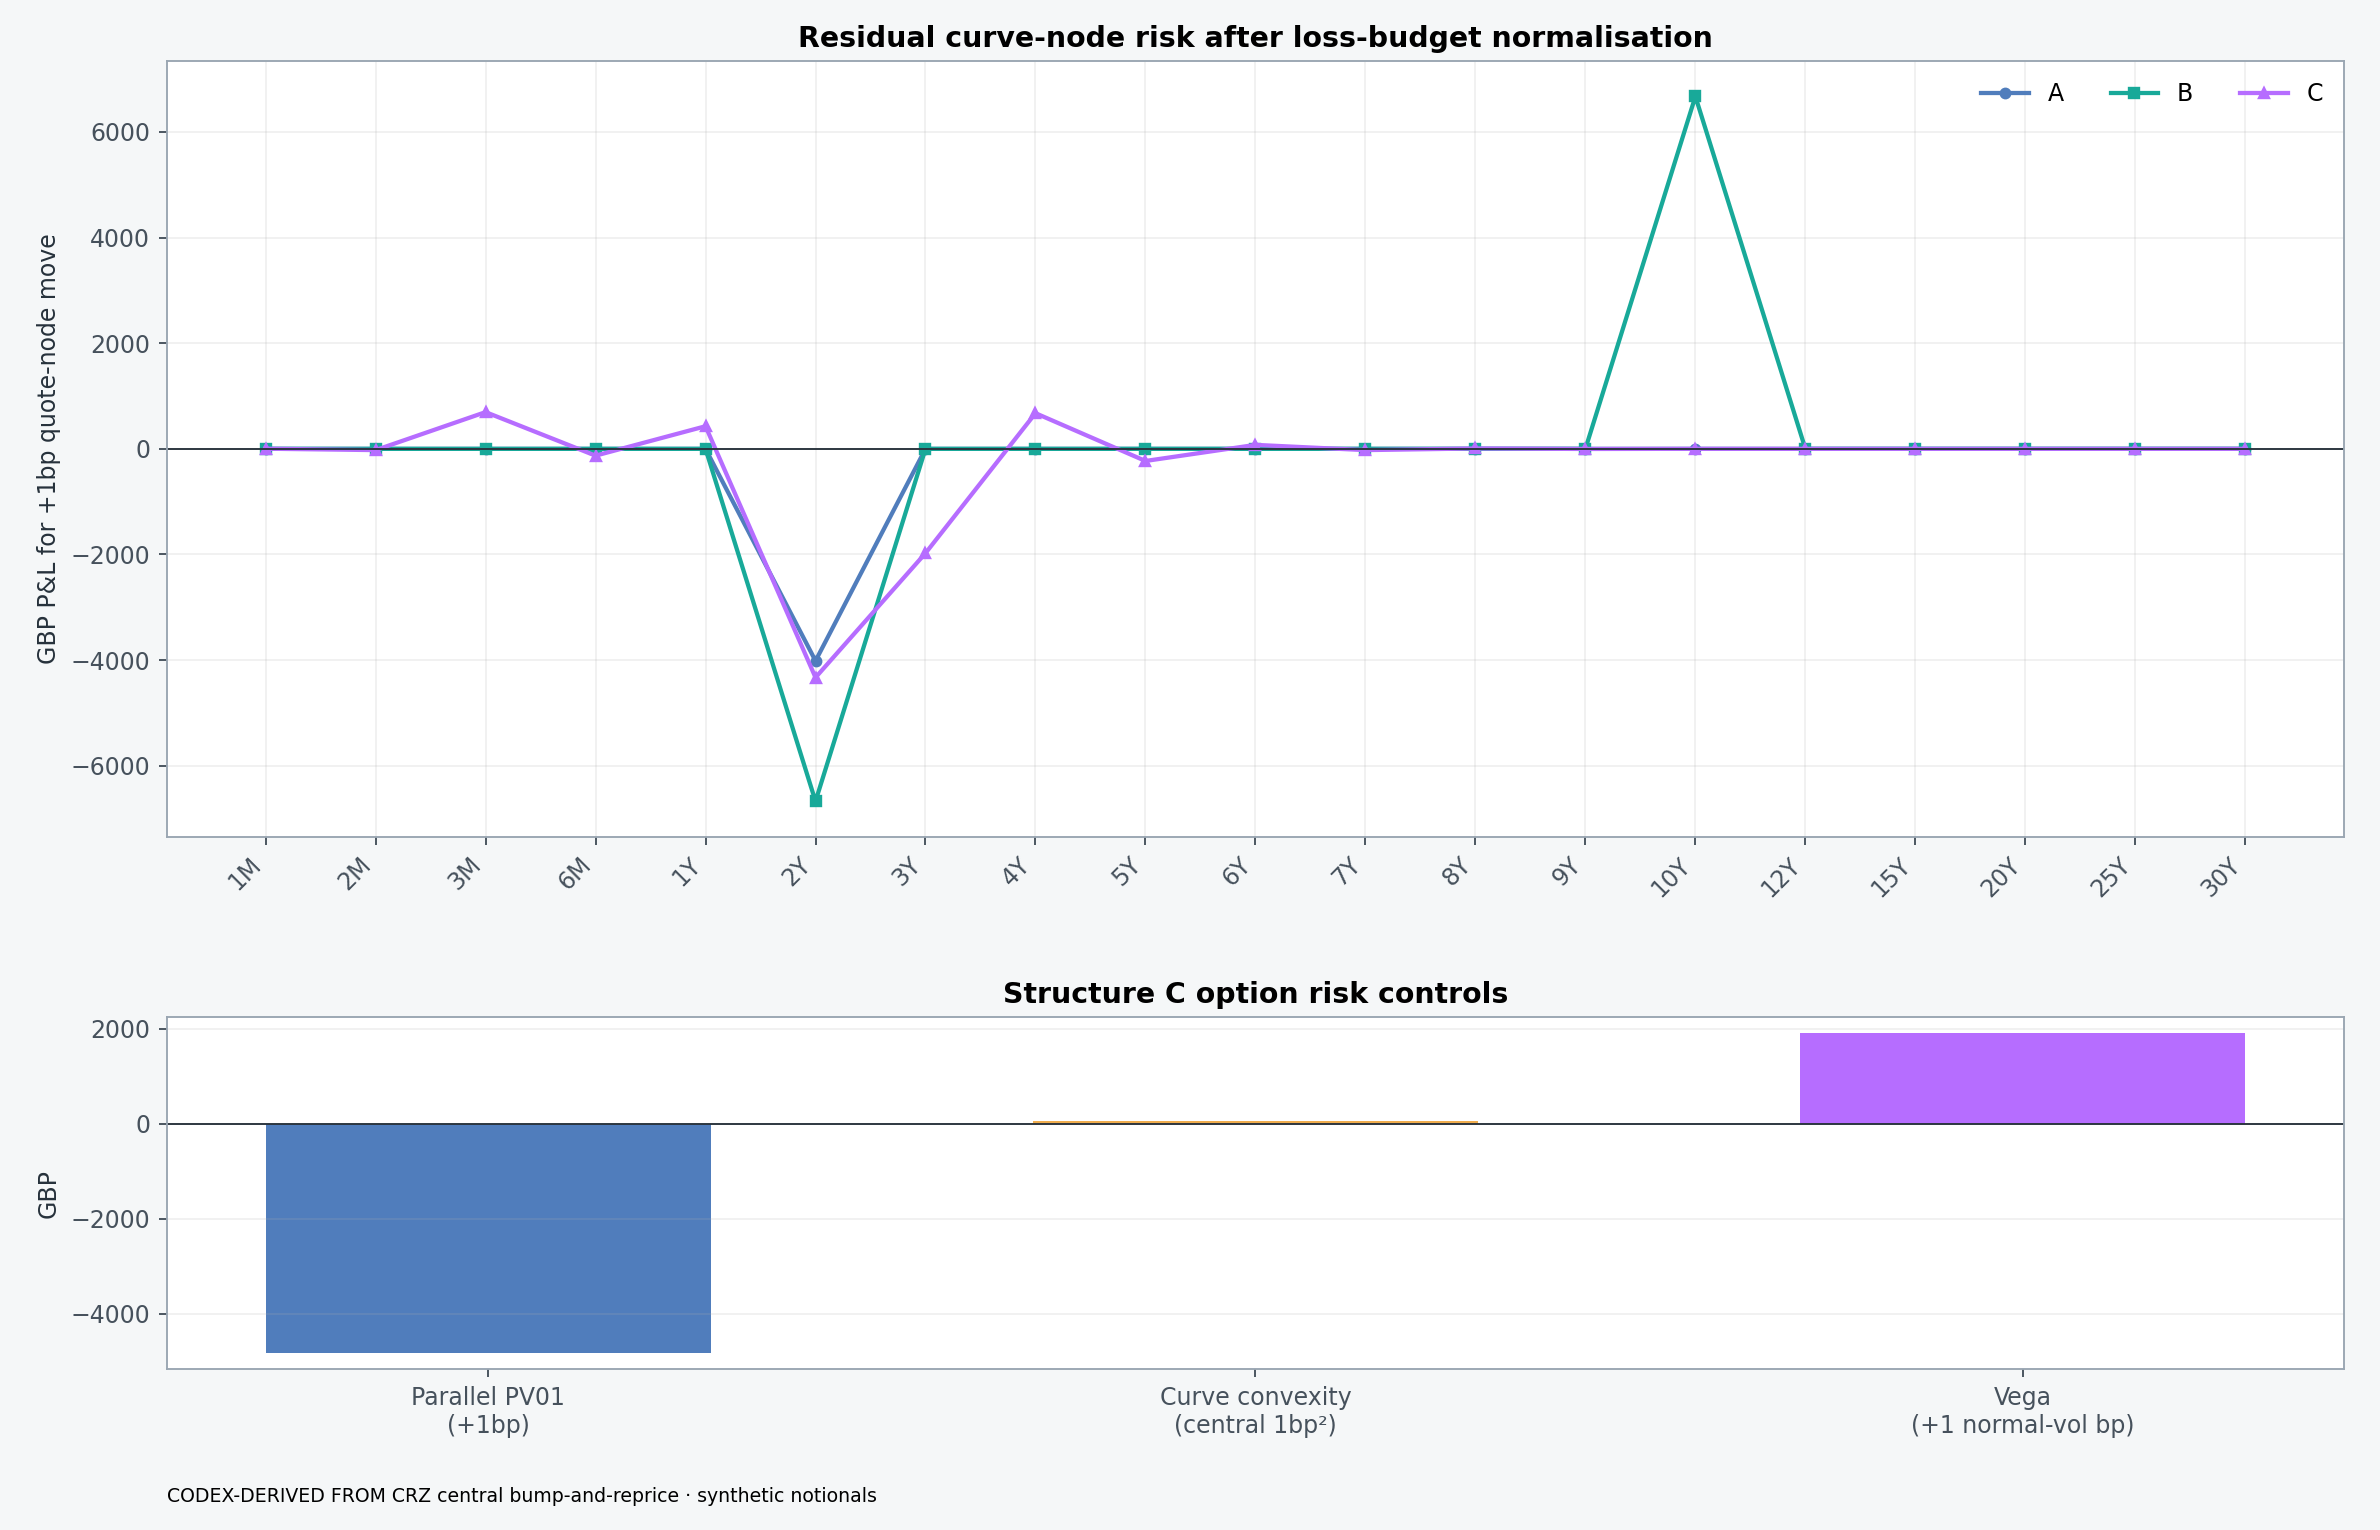
The charts show where each trade retains rate and volatility exposure.
Grouped bars comparing named-view gross P&L, adverse gross P&L and upfront premium for structures A, B and C
Same synthetic adverse-loss budget, different exposure and funding shape.
Curve-node PV01 ladders for structures A, B and C, followed by parallel PV01, convexity and vega for the receiver swaption
Curve-node risk, option parallel sensitivity, convexity and normal-volatility vega.
Nine labelled heatmaps giving gross scenario P&L for the three structures across 2Y, 10Y and normal-volatility shocks
CRZ valuations at the example’s position sizes · 48 common grid scenarios for every structure.

Extending the example into a monitor

A monitoring application could repeat these calculations against updated markets and compare the results with the desk’s thresholds.

The information an alert would contain

An alert would identify the affected position, the threshold crossed and the change in price or risk, with the market date and calculation record attached.

Calculation method

The experiment records its market inputs, calculation checks and excluded costs.
Market inputs and calculation method

The run uses a frozen CRZ close from 15 November 2023 and synthetic positions. Scenario results are immediate gross repricing. Carry/theta, roll-down, bid/offer, transaction costs, liquidity, marginal SIMM and formal realised P&L sit outside this run.

CRZ supplies the valuations and sensitivities. The example combines those outputs to size positions and compare scenarios. Calculations were run on 21 July 2026 using the historical close. The GBPOIS historical record was later backfilled; the underlying vendor is not identified in the source record.

What would your desk ask next?

Bring one recurring pricing, risk or monitoring question. I can help assess how CRZ could support it.

Discuss your desk